Working with Color-Driven Icons
The Color-Driven Icons functionality can show shapes like arrows in tables and charts depending on the fill or font color in the linked cell in the workbook. You can do this manually as well off course, but there are a few reasons to automate this process:
1. Avoid human errors - Automation secures the right icon is placed in the right place
2. Precision - Automation takes care of the exact positioning
3. Save Time - After defining which icons to show depending on specific colors, you can use the same definitions for other tables and charts. You can even reuse the definitions in other presentations by importing the definitions from another presentation.
Creating the Color-Driven Icons definitions
Before we can automatically display icons in your tables and charts, you need to define which icons should be shown when the linked cell in the workbook contains specific fill or font colors. Please have a look at this video showing how to do that.
Here a description of the process as you can see in the video:
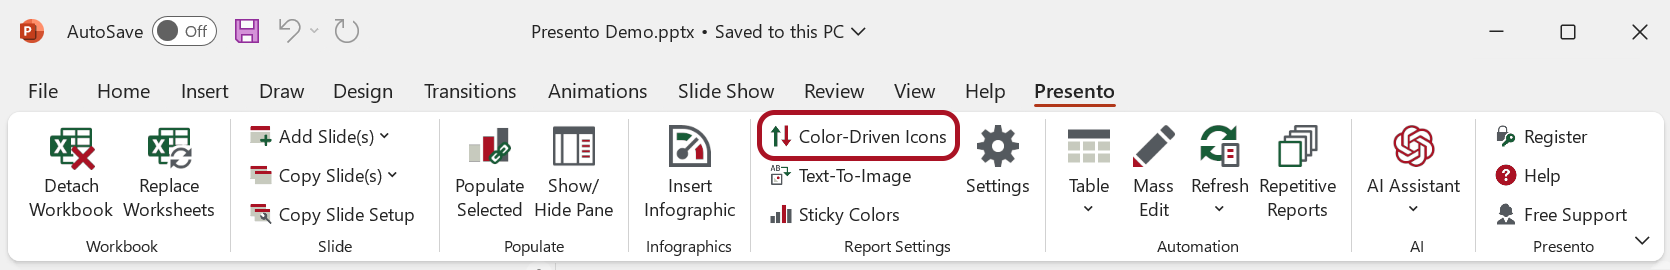
Please click 'Color-Driven Icons' in the ribbon tab. A form will appear, allowing you to define which icons should be associated with particular background or font colors in your workbook:
Defining a Color-Driven Icon
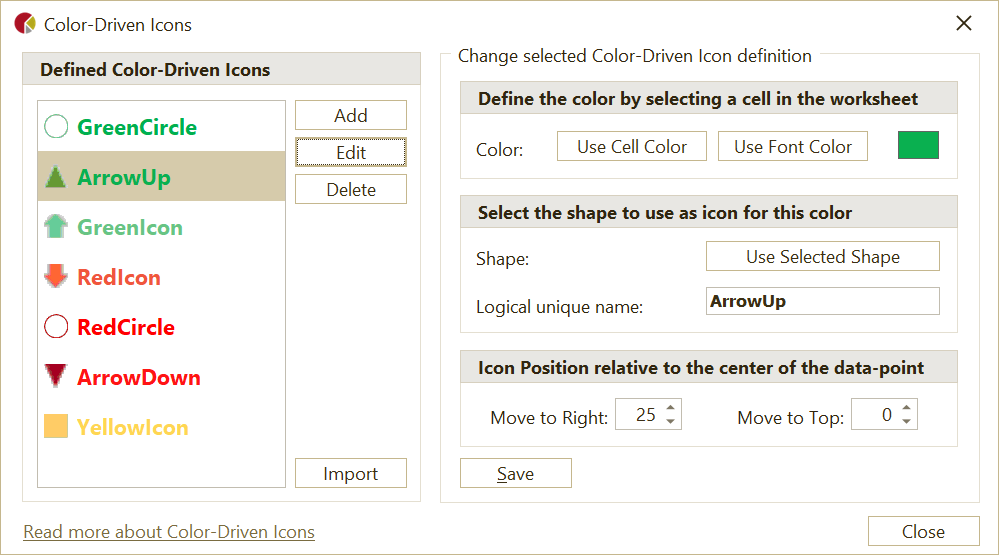
To define an icon that appears based on the background or font color of a cell in your workbook, follow these simple steps:
- Select a Workbook Cell: Choose a cell in your workbook that has the background or font color you want to use as a trigger for the icon.
- Define the Color: Click on 'Use Cell Color' or 'Use Font Color' to specify the color that should trigger the icon.
- Choose Your Icon Shape: Select the shape you want to use as the icon. This can be any PowerPoint shape, so you have the flexibility to create your own or import a small image.
- Define the Icon: Click 'Use Selected Shape' to confirm your choice and define the icon.
- Set the Icon's Position: Determine the icon's position relative to the center of the data. If you want the icon to appear right next to the data, adjust the position accordingly. Finding the right value may require some trial and error, especially if you're using arrow shapes or shapes with specific placement requirements.
Note: Using negative values for the icon position will result in moving the icon to the left or the bottom.
Note: The chosen shape will be copied to slide 1 and will be hidden. Do NOT delete this hidden shape!
Applying Color-Driven Icons
Once you've defined Color-Driven Icons, please select the table or chart for which you want to show icons. In the 'Populated Pane' in the right side of PowerPoint, check 'Show Color-Driven Icons' in the bottom of the pane. Your table or chart will now display the defined icons based on the background or font colors in your linked workbook cells:
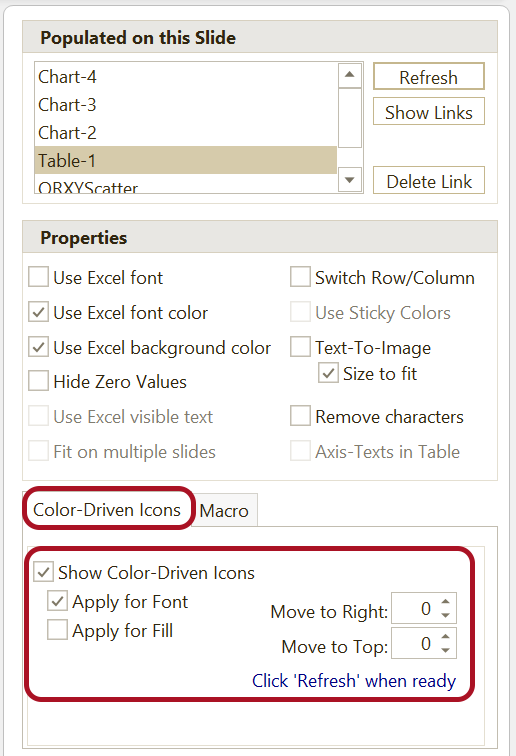
Here you can overrule the default positioning defined for the Color-Driven Icon.
Different Icons based on the same color
You can overrule the defined icon on specific slides by adding another shape to the specific slide and give this shape the same name as the defined 'Logical unique name'. Presento will first look for a shape with the defined name on the current slide. If no shape with the name is defined on the slide, the shape from slide 1 will be used.